This a nice post from http://jeroenjanssens.com/2013/09/19/seven-command-line-tools-for-data-science.html. If you play with data, these tools would be interesting for you.
Tools suggested by others can be found at the bottom of the post.
Data science is OSEMN (pronounced as awesome). That is, it involves Obtaining, Scrubbing, Exploring, Modeling, and iNterpreting data. As a data scientist, I spend quite a bit of time on the command-line, especially when there's data to be obtained, scrubbed, or explored. And I'm not alone in this. Recently, Greg Reda discussed how the classics (e.g., head, cut, grep, sed, and awk) can be used for data science. Prior to that, Seth Brown discussed how to perform basic exploratory data analysis in Unix.
I would like to continue this discussion by sharing seven command-line tools that I have found useful in my day-to-day work. The tools are: jq, json2csv, csvkit, scrape,xml2json, sample, and Rio. (The home-made tools
scrape, sample, and Rio can be found in this data science toolbox.) Any suggestions, questions, comments, and even pull requests are more than welcome. OSEMN, let's get started with our first tool: jq.1. jq - sed for JSON
JSON is becoming an increasingly common data format, especially as APIs are appearing everywhere. I remember cooking up the ugliest
grep and sed incantations in order to process JSON. Thanks to jq, those days are now in the past.
Imagine we're interested in the candidate totals of the 2008 presidential election. It so happens that the New York Times has a Campaign Finance API. (You can get your own API keys if you want to access any of their APIs.) Let's get some JSON using
curl:curl -s 'http://api.nytimes.com/svc/elections/us/v3/finances/2008/president/totals.json?api-key=super-secret' > nyt.json
where
-s puts curl in silent mode. In its simplest form, i.e., jq '.', the tool transforms the incomprehensible API response we got:{"status":"OK","base_uri":"http://api.nytimes.com/svc/elections/us/v3/finances/2008/","cycle":2008,"copyright":"Copyright (c) 2013 The New York Times Company. All Rights Reserved.","results":[{"candidate_name":"Obama, Barack","name":"Barack Obama","party":"D",
into nicely indented and colored output:
< nyt.json jq '.' | head
{
  "results": [
    {
      "candidate_id": "P80003338",
      "date_coverage_from": "2007-01-01",
      "date_coverage_to": "2008-11-24",
      "candidate_name": "Obama, Barack",
      "name": "Barack Obama",
      "party": "D",
Note that the output isn't necessarily in the same order as the input. Besides pretty printing,
jq can also select, filter, and format JSON data, as illustrated by the following command, which returns the name, cash, and party of each candidate that had at least $1,000,000 in cash:< nyt.json jq -c '.results[] | {name, party, cash: .cash_on_hand} | select(.cash | tonumber > 1000000)'
{"cash":"29911984.0","party":"D","name":"Barack Obama"}
{"cash":"32812513.75","party":"R","name":"John McCain"}
{"cash":"4428347.5","party":"D","name":"John Edwards"}
Please refer to the jq manual to read about the many other things it can do, but don't expect it to solve all your data munging problems. Remember, the Unix philosophy favors small programs that do one thing and do it well. And
jq's functionality is more than sufficient I would say! Now that we have the data we need, it's time to move on to our second tool: json2csv.2. json2csv - convert JSON to CSV
While JSON is a great format for interchanging data, it's rather unsuitable for most command-line tools. Not to worry, we can easily convert JSON into CSV using json2csv. Assuming that we stored the data from the last step in
million.json, simply invoking< million.json json2csv -k name,party,cash
will convert it to some nicely comma-separated values:
Barack Obama,D,29911984.0
John McCain,R,32812513.75
John Edwards,D,4428347.5
Having the data in CSV format allows us to use the classic tools such as
cut -d, andawk -F,. Others like grep and sed don't really have a notion of fields. Since CSV is the king of tabular file formats, according to the authors of csvkit, they created, well,csvkit.3. csvkit - suite of utilities for converting to and working with CSV
Rather than being one tool, csvkit is a collection of tools that operate on CSV data. Most of these tools expect the CSV data to have a header, so let's add one. (Ideally,
json2csvwould have added the header.)echo name,party,cash | cat - million.csv > million-header.csv
We can, for example, sort the candidates by cash with
csvsort and display the data using csvlook:< million-header.csv csvsort -rc cash | csvlook
|---------------+-------+--------------|
| name | party | cash |
|---------------+-------+--------------|
| John McCain | R | 32812513.75 |
| Barack Obama | D | 29911984.0 |
| John Edwards | D | 4428347.5 |
|---------------+-------+--------------|
Looks like the MySQL console doesn't it? Speaking of databases, you can insert the CSV data into an sqlite database as follows (many other databases are supported as well):
csvsql --db sqlite:///myfirst.db --insert million-header.csv
sqlite3 myfirst.db
sqlite> .schema million-header
CREATE TABLE "million-header" (
    name VARCHAR(12) NOT NULL,
    party VARCHAR(1) NOT NULL,
    cash FLOAT NOT NULL
);
In this case, the database columns have the correct data types because the type is inferred from the CSV data. Other tools within
csvkit that might be of interest are:in2csv, csvgrep, and csvjoin. And with csvjson, the data can even be converted back to JSON. All in all, csvkit is worth checking out.4. scrape - HTML extraction using XPath or CSS selectors
JSON APIs sure are nice, but they aren't the only source of data; a lot of it isunfortunately still embedded in HTML. scrape is a python script I put together that employs the
lxml and cssselect packages to select certain HTML elements by means of an XPath query or CSS selector. (I tried scrape.pl, but I couldn't get it to work properly. Moreover, rather than processing HTML from stdin, it expects a url and then downloads the HTML itself.) Let's extract the table from this Wikipedia article that lists the border and area ratio of each country.curl -s 'http://en.wikipedia.org/wiki/List_of_countries_and_territories_by_border/area_ratio' | scrape -b -e 'table.wikitable > tr:not(:first-child)' | head
<!DOCTYPE html>
<html>
<body>
<tr>
<td>1</td>
<td>Vatican City</td>
<td>3.2</td>
<td>0.44</td>
<td>7.2727273</td>
</tr>
The
-b argument lets scrape enclose the output with <html> and <body> tags, which is sometimes required by xml2json to convert correctly the HTML to JSON.5. xml2json - convert XML to JSON
As its name implies, xml2json takes XML (and HTML) as input and returns JSON as output. Therefore,
xml2json is a great liaison between scrape and jq.curl -s 'http://en.wikipedia.org/wiki/List_of_countries_and_territories_by_border/area_ratio' | scrape -be 'table.wikitable > tr:not(:first-child)' | xml2json | jq -c '.html.body.tr[] | {country: .td[1][], border: .td[2][], surface: .td[3][], ratio: .td[4][]}' | head
{"ratio":"7.2727273","surface":"0.44","border":"3.2","country":"Vatican City"}
{"ratio":"2.2000000","surface":"2","border":"4.4","country":"Monaco"}
{"ratio":"0.6393443","surface":"61","border":"39","country":"San Marino"}
{"ratio":"0.4750000","surface":"160","border":"76","country":"Liechtenstein"}
{"ratio":"0.3000000","surface":"34","border":"10.2","country":"Sint Maarten (Netherlands)"}
{"ratio":"0.2570513","surface":"468","border":"120.3","country":"Andorra"}
{"ratio":"0.2000000","surface":"6","border":"1.2","country":"Gibraltar (United Kingdom)"}
{"ratio":"0.1888889","surface":"54","border":"10.2","country":"Saint Martin (France)"}
{"ratio":"0.1388244","surface":"2586","border":"359","country":"Luxembourg"}
{"ratio":"0.0749196","surface":"6220","border":"466","country":"Palestinian territories"}
Of course this JSON data could then be piped into
json2csv and so forth.6. sample - when you're in debug mode
The second tool I made is sample. (It's based on two scripts in bitly's data_hacks, which contains some other tools worth checking out.) When you're in the process of formulating your data pipeline and you have a lot of data, then debugging your pipeline can be cumbersome. In that case,
sample might be useful. The tool serves three purposes (which isn't very Unix-minded, but since it's mostly useful when you're in debug mode, that's not such a big deal).
The first purpose of
sample is to get a subset of the data by outputting only a certain percentage of the input on a line-by-line basis. The second purpose is to add some delay to the output. This comes in handy when the input is a constant stream (e.g., the Twitter firehose), and the data comes in too fast to see what's going on. The third purpose is to run only for a certain time. The following invocation illustrates all three purposes.seq 10000 | sample -r 20% -d 1000 -s 5 | jq '{number: .}'
This way, every input line has a 20% chance of being forwarded to
jq. Moreover, there is a 1000 millisecond delay between each line and after five seconds sample will stop entirely. Please note that each argument is optional. In order to prevent unnecessary computation, try to put sample as early as possible in your pipeline (the same argument holds for head and tail). Once you're done debugging you can simply take it out of the pipeline.7. Rio - making R part of the pipeline
This post wouldn't be complete without some R. It's not straightforward to make R/Rscript part of the pipeline since they don't work with stdin and stdout out of the box. Therefore, as a proof of concept, I put together a bash script called Rio.
Rio works as follows. First, the CSV provided to stdin is redirected to a temporary file and lets R read that into a data frame df. Second, the specified commands in the -eoption are executed. Third, the output of the last command is redirected to stdout. Allow me to demonstrate three one-liners that use the Iris dataset (don't mind the url).
Display the five-number-summary of each field.
curl -s 'https://raw.github.com/pydata/pandas/master/pandas/tests/data/iris.csv' > iris.csv
< iris.csv Rio -e 'summary(df)'
  SepalLength      SepalWidth     PetalLength      PetalWidth
 Min.   :4.300   Min.   :2.000   Min.   :1.000   Min.   :0.100
 1st Qu.:5.100   1st Qu.:2.800   1st Qu.:1.600   1st Qu.:0.300
 Median :5.800   Median :3.000   Median :4.350   Median :1.300
 Mean   :5.843   Mean   :3.054   Mean   :3.759   Mean   :1.199
 3rd Qu.:6.400   3rd Qu.:3.300   3rd Qu.:5.100   3rd Qu.:1.800
 Max.   :7.900   Max.   :4.400   Max.   :6.900   Max.   :2.500
     Name
 Length:150
 Class :character
 Mode  :character
If you specify the
-s option, the sqldf package will be imported. In case tthe output is a data frame, CSV will be written to stdout. This enables you to further process that data using other tools.< iris.csv Rio -se 'sqldf("select * from df where df.SepalLength > 7.5")' | csvlook
|--------------+------------+-------------+------------+-----------------|
|  SepalLength | SepalWidth | PetalLength | PetalWidth | Name            |
|--------------+------------+-------------+------------+-----------------|
|  7.6         | 3          | 6.6         | 2.1        | Iris-virginica  |
|  7.7         | 3.8        | 6.7         | 2.2        | Iris-virginica  |
|  7.7         | 2.6        | 6.9         | 2.3        | Iris-virginica  |
|  7.7         | 2.8        | 6.7         | 2          | Iris-virginica  |
|  7.9         | 3.8        | 6.4         | 2          | Iris-virginica  |
|  7.7         | 3          | 6.1         | 2.3        | Iris-virginica  |
|--------------+------------+-------------+------------+-----------------|
If you specify the
-g option, ggplot2 gets imported and a ggplot object called g with dfas the data is initialized. If the final output is a ggplot object, a PNG will be written to stdout.< iris.csv Rio -ge 'g+geom_point(aes(x=SepalLength,y=SepalWidth,colour=Name))' > iris.png
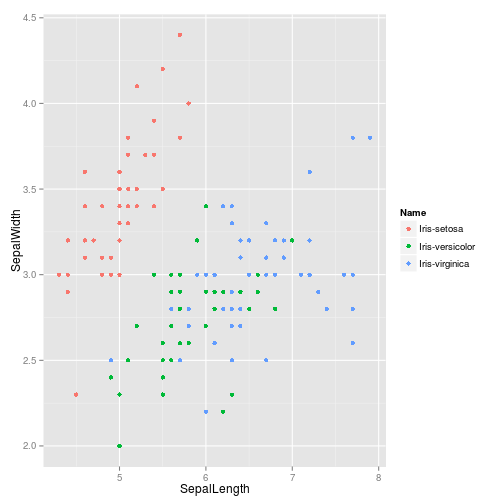
I made this tool so that I could take advantage of the power of R on the command-line. Of course it has its limits, but at least there's no need to learn gnuplot any more.
Conclusion
I have shown you seven command-line tools that I use in my daily work as a data scientist. While each tool is useful in its own way, I often find myself combining them with, or just resorting to, the classics such as
grep, sed, and awk. Combining such small tools into a larger pipeline is what makes them really powerful.
I'm curious to hear what you think about this list and what command-line tools you like to use. Also, if you've made any tools yourself, you're more than welcome to add them to this data science toolbox.
Don't worry if you don't regard yourself as a toolmaker. The next time you're cooking up that exotic pipeline, consider to put it in a file, add a shebang, parametrize it with some
$1s and $2s, and chmod +x it. That's all there is to it. Who knows, you might even become interested in applying the Unix philosophy.
While the power of the command-line should not be underestimated when it comes to Obtaining, Scrubbing, and Exploring data, it can only get you so far. When you're ready to do some more serious Exploring, Modelling, and iNterpretation of your data, you're probably better off continuing your work in a statistical computing environment, such as R or IPython notebook+pandas.
If you enjoyed this post, then you may want to follow me on Twitter.
Command-line tools suggested by others
Below is an uncurated list of tools and repositories that others have suggested viatwitter or Hacker News.
I will soon have a look at all these tools and update the post accordingly. Thanks everybody.

39 Comments:
Leatheriza is offering a wide variety of handcrafted leather jackets online for men as well as leather jackets for women also we have handmade leather shoes for men with other leather products such as leather messenger bags.
Excellent information, thanks for sharing.
I'm from the US and need someone to recommend a buy essay cheap writing service to me so I can finish my college application essay.
Overall, getting Business Loan Leads can be a great way to get the financing you need for your business. Just be sure to do your research and work with a reputable company.
The 7 command-line tools for data science are incredibly useful and can allow you to quickly and easily analyze large datasets. It is a great way to get started with data science and make the most of your data. Highly recommend!
Software development is the process programmers use to build computer programs.
Software development companies list
The process, also known as the Software Development Life Cycle (SDLC), includes several phases that provide a method for building products that meet technical specifications and user requirements.
Information is beyond brilliant. I am a Study Abroad consultant for United Kingdom would like to know more about this.
It is imperative that we read blog post very carefully. I am already done it and find that this post is really amazing.
If you're a data scientist looking for efficient command-line tools, here are seven recommendations to streamline your workflow. While these tools are specifically designed for data science tasks, it's worth noting that they can also be beneficial for other purposes, such as analyzing datasets, processing large-scale data, and automating workflows. Additionally, if you're interested in expanding your toolkit, don't forget to explore our website where we offer a wide range of high-quality men's clothing for all occasions. Happy exploring!
It's fascinating to explore the realm of data science, and leveraging command-line tools can greatly enhance efficiency and productivity. One key aspect often overlooked is ensuring a robust infrastructure. Just like how 7000815-000 - Dell 930-Watts Power Supply is crucial for consistent power in a system, having a stable and reliable computing environment is paramount for effective data science work.
Businesses can also hire product description writers to help them define their items. The greatest method to reach out to your consumers is to describe who you are.sell your boat Nothing can stop a business from flourishing if it concentrates on the sixth point as well as the first five. Very well-written piece.
Command-line tools like head, cut, grep, sed, and awk play a crucial role in efficiently handling various data science tasks. They streamline processes for obtaining, scrubbing, and exploring data, making them invaluable tools for data scientists. The power of the command line is a shared sentiment among professionals, enhancing the effectiveness of tasks throughout the data science workflow.
This post would be incomplete without some R. It is difficult to incorporate R/Rscript into the pipeline because they do not function with stdin and stdout by default. As a proof of concept, I created a bash script named Rio. Thank you for sharing your insight! Keep up the great work! Continue sharing. Please feel free to browse my website.
Your blog post has not only expanded my toolkit but also inspired me to delve deeper into the command-line world of data science. Keep up the fantastic work, Jeffy! I'll definitely be following you on Twitter for more insights and updates. Cheers!
Professionals working with enormous datasets and intricate analysis find that data science command-line tools are indispensable. These tools improve efficiency and productivity with their strong functionality and automation capabilities. It's interesting to note that many successful people who failed school have found success in the technology industry, where they use command-line tools to make important contributions. Their experiences demonstrate the possibility of independent learning and the transforming influence of real-world knowledge in the data science industry.
Command line tools are essential for data scientists. They offer speed and efficiency. Learning tools like bash, Python, and R can significantly boost your productivity. While mastering these tools is crucial, don't forget the importance of strong communication skills. A linguistics essay writing service Uk can help you develop those for academic or professional purposes.
Command-line tools like grep, awk, and sed are essential for data cleaning, exploration, and manipulation in ||How to Get A Divorce in New York State||Is New York A Community Property State for Divorce data science.
thank you for sharing! Abogado de Divorcio Hampton VA | Abogado de Divorcio Hampton Virginia
These are some of the best Goodie Bags ideas I’ve seen! It’s always nice to send guests home with a fun little surprise that they’ll actually enjoy
Exploring the potential of command-line tools for data science – where coding meets efficiency and each script feels like magic in the works! Arlington Criminal Defense Attorney Do you require experienced legal advice? Allow SrisLawyer to help you through your legal path with reliable guidance and proven results. Contact us now to ensure your piece of mind!
Information science is OSEMN (articulated as marvelous). That is, it includes Acquiring, Scouring, Investigating, Demonstrating, and Deciphering information. As an information researcher, I invest a lot of energy on the order line, particularly when there's information to be gotten, cleaned, or investigated. 4th degree sex offense maryland Furthermore, I'm in good company in this. As of late, Greg Reda examined how the works of art (e.g., head, cut, grep, sed, and awk) can be utilized for information science. Preceding that, Seth Brown examined how to perform fundamental exploratory information examination in Unix.
Great post! Command-line tools are essential for streamlining workflows in data science, and it's exciting to see how powerful they can be when combined with scripts and automation. Tools like jq, grep, and awk are game-changers for manipulating and analyzing data quickly without the overhead of full IDEs. I also love using tmux for managing multiple sessions efficiently. Would love to see more examples or best practices on integrating these tools with Python or R in real-world data science projects! Virginia Embezzlement Defense Lawyers Protect your rights—connect with experienced legal professionals today!
Command-line tools are a game-changer for data science, offering simplicity and efficiency. While exploring these tools, stay cozy and stylish with Shearling Jackets , perfect for tackling challenges in comfort!
¡Gran publicación! Las herramientas de línea de comandos son esenciales para optimizar los flujos de trabajo en la ciencia de datos y es emocionante ver cuán poderosas pueden ser cuando se combinan con scripts y automatización. Herramientas como jq, grep y awk cambian las reglas del juego para manipular y analizar datos rápidamente sin la sobrecarga de los IDE completos. También me encanta usar tmux para gestionar múltiples sesiones de manera eficiente.abogado tráfico suffolk virginia
Git is essential for version control since it makes sure that script and dataset changes are effectively tracked. Lastly, data scientists can monitor system performance using htop, a terminal-based system monitor, particularly while working on data-intensive projects. These command-line tools provide more automation and control over daily chores in addition to expediting the data science workflow. Penalty for soliciting prostitution.
These command-line tools are the unsung heroes of data science workflows, helping to automate tasks, improve productivity, and manage large datasets. By integrating them into your workflow, you can streamline your processes and focus more on analysis and insights.
falls church divorce lawyer
This article on "7 Command-Line Tools for Data Science" is incredibly insightful, especially for professionals aiming to streamline data handling and analysis efficiently. Tools like Git, Curl, and jq offer powerful ways to automate tasks and manipulate data with speed and precision. For those in creative tech industries, like best embroidery digitizing, leveraging such tools can optimize workflow, improve file management, and support data-driven design enhancements. Command-line proficiency is becoming essential, not just in data science but across modern digital professions. Overall, this is a must-read for anyone serious about integrating smart tools into their daily work process.
Very well-written and easy to understand. Thanks for sharing! Please write an article about Orthopedic clinics in Valencia.
Very useful post. Thanks for putting this together. Please write an article about How To Propagate Aloe Vera Plant.
Love how you covered all the key points. Great work! Please write an article about who can defeat black adam.
Great site and a great topic. I'm amazed to read this. It's excellent. Write more... MM
I like this blog very much, Its a really nice position to read and get info... MM
Hello! I wish to say that this article is awesome, this is great written... MM
It's really a nice and helpful piece of information. I am happy that you shared this... MM
Helpful information here. Please stay us updated like this. Thanks for sharing this... MM
Thanks for sharing! Here are 7 essential command-line tools for data science: Python, R, Git, AWK, sed, jq, and curl. They help in data cleaning, manipulation, version control, and fetching data efficiently. Mastering these tools streamlines workflows and boosts productivity for any data-driven project. arlington dui lawyer
Here are 7 essential command-line tools for data science: Python, R, Git, AWK, sed, jq, and curl. They help in data cleaning, manipulation, version control, and fetching data efficiently. Mastering these tools streamlines workflows and boosts productivity for any data-driven project.
Palm trees
I recently explored mcw and found it user-friendly, fast, and reliable. The platform offers smooth navigation and exciting features, making mcw a great choice for anyone seeking a secure online gaming experience.
mcw
Post a Comment